Maple Valley Home Prices Are Down. So Why Are Homes Still Selling Fast?
Maple Valley home prices have softened year over year, but homes are still moving relatively quickly because buyer demand has not disappeared and successful listings are still closing close to asking price. July 2026 NWMLS-derived data puts the Maple Valley median sold price at $752,500, down 6.7% from a year earlier, while homes sold in a median of 12 days and averaged 99.5% of list price.
That combination tells a more useful story than either “prices are falling” or “Maple Valley is still a hot seller's market.”
Buyers have more homes to compare. Sellers face more competition. Pricing matters more. But desirable homes that match current buyer expectations can still move quickly.
For Maple Valley buyers, sellers, and homeowners, the market is sending several signals at once. Understanding how those signals fit together is more valuable than relying on one headline number.
Key takeaways
- Maple Valley's July 2026 median sold price was $752,500, down 6.7% year over year in one NWMLS-derived city-level report.
- Homes were still selling in a median 12 days, with an average 99.5% sale-to-list ratio in that same July dataset.
- Zillow's June data also showed year-over-year softness, with its typical Maple Valley home value down 2.7% and homes going pending in about 13 days.
- Different market websites show different prices because they may use different dates, geographic boundaries, property types, and statistical methods.
- More inventory gives buyers more choice, but it does not mean every seller will accept a steep discount.
- Sellers still need to price against current competition rather than older peak-market expectations.
- King County data is useful as broader context, but Maple Valley-specific data should carry more weight when evaluating a Maple Valley home.
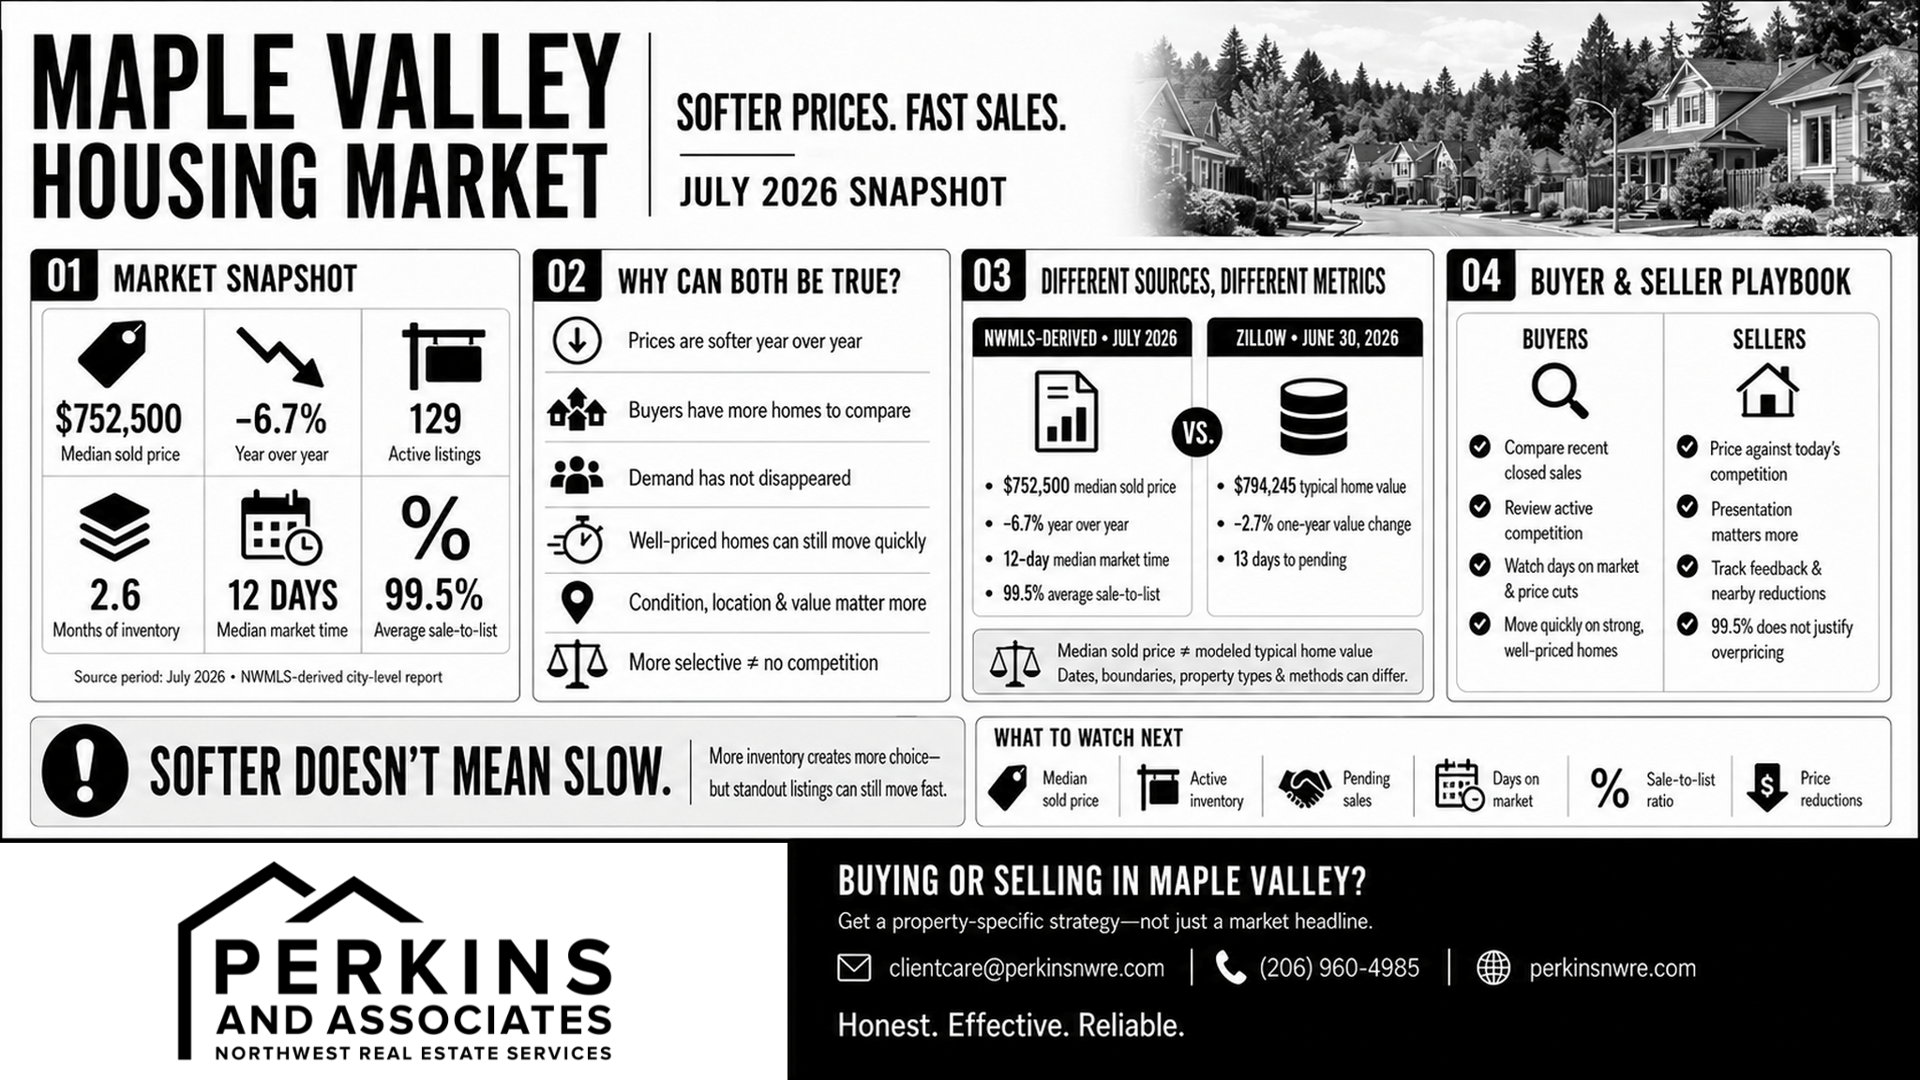
Maple Valley housing market snapshot
Metric | Current signal | Source period |
|---|---|---|
Median sold price | $752,500 | July 2026 |
Year-over-year median change | -6.7% | July 2026 |
Active listings | 129 | July 2026 |
Months of inventory | 2.6 | July 2026 |
Median days on market | 12 days | July 2026 |
Average sale-to-list ratio | 99.5% | July 2026 |
Zillow typical home value | $794,245 | June 30, 2026 |
Zillow one-year value change | -2.7% | June 30, 2026 |
Zillow median days to pending | 13 days | June 30, 2026 |
The July figures above come from an NWMLS-derived Maple Valley market report, while Zillow's figures use its own Home Value Index and marketplace data. They should be compared carefully rather than treated as identical measurements.
Are Maple Valley home prices dropping in 2026?
Yes, several current measures show year-over-year price softness in Maple Valley, but that does not mean every local home has lost the same percentage of value.
The July 2026 NWMLS-derived report shows a $752,500 median sold price, down 6.7% from July 2025.
Redfin also shows softer pricing. Its three-month period ending in May 2026 reported a Maple Valley median sale price of approximately $739,000, down 2.8% year over year.
Realtor.com reported a $737,000 median sold price in June 2026, down 7.12% year over year in its citywide dataset.
Those numbers differ, but the direction is fairly consistent: Maple Valley pricing has been softer than it was a year earlier across several current datasets.
Does that mean every Maple Valley home lost 6.7%?
No. A change in the median sold price does not mean every home's market value changed by the same percentage.
A median sale price simply identifies the middle price among the homes that sold during a reporting period.
It can change because:
- more lower-priced homes sold,
- fewer luxury homes closed,
- the mix of new construction changed,
- more townhomes or smaller homes sold,
- the number of transactions changed,
- or actual property values changed.
Usually, several of those factors interact.
That is why a citywide median is useful for understanding the direction of the market, but it should not replace a property-specific analysis.
For more background on Maple Valley price direction, see our guide to whether Maple Valley home prices are going up or down.
Why do Maple Valley housing websites show different home prices?
Different housing websites can show different Maple Valley prices because they are often measuring different things.
This is one of the most important points for anyone researching the market.
Consider three current figures:
- An NWMLS-derived July report shows a $752,500 median sold price.
- Redfin shows a roughly $739,000 median sale price over its three-month reporting window ending in May.
- Zillow shows a $794,245 typical home value, while separately reporting a $744,650 median sale price for May.
These are not necessarily contradictory.
Median sold price versus typical home value
A median sold price describes actual homes that closed during a specific period. Zillow's Home Value Index is a model designed to estimate the typical value of homes across a broader housing stock.
Zillow describes its Home Value Index as a measure based on monthly changes in property-level Zestimate values across housing types and geographies.
Those two measures answer different questions.
Median sale price asks:
What did the middle home among recent closed sales sell for?
A home-value index asks something closer to:
What is the estimated typical value of the area's housing stock?
Neither is automatically wrong.
They should not be presented as though they are the same metric.
Dates matter too
July closed-sale data should not be directly compared with a May three-month average without explaining the reporting period.
Housing markets are seasonal, and the mix of properties sold can change from month to month.
Geography matters
Some reports also use market areas that extend beyond Maple Valley's city limits.
That matters because combining Maple Valley with nearby Black Diamond or other areas changes the mix of homes being measured.
For this article, Maple Valley city-level data remains the primary focus.
Why are Maple Valley homes still selling quickly if prices are softer?
Softer prices and relatively fast sales can happen at the same time when homes are priced closer to what current buyers are willing to pay.
In the July NWMLS-derived dataset, Maple Valley homes sold in a median of 12 days.
Zillow reported homes going pending in approximately 13 days as of June 30.
Redfin's three-month data also described Maple Valley as highly competitive, with homes averaging around 8 days on market during its May reporting window and typical homes going pending around list price.
That tells us buyer activity has not disappeared.
What has changed is the environment in which buyers are making decisions.
When inventory increases and buyers have more alternatives, they can become more selective about:
- price,
- condition,
- location,
- updates,
- lot quality,
- commute,
- inspection issues,
- and overall value.
A well-positioned home can still receive quick attention.
An overpriced or poorly presented home may have a very different experience.
What fast sales do not mean
A 12-day median does not mean:
- every Maple Valley home sells in 12 days,
- every property receives multiple offers,
- every seller gets full asking price,
- buyers have no negotiation room,
- or sellers can price well above comparable sales without consequences.
Redfin's current data, for example, shows that some homes sell above list while others sell below it, reinforcing that performance varies property by property.
Is housing inventory increasing in Maple Valley?
Yes. Buyers have more Maple Valley homes to consider than they did during the most inventory-constrained periods, although supply is still limited enough that strong listings can move quickly.
The July NWMLS-derived report counted 129 active listings and 2.6 months of inventory.
Zillow independently reported 138 for-sale listings as of June 30.
Realtor.com's June dataset showed 162 active listings, up 11.19% year over year under its methodology.
The exact inventory count varies by source and date, but the broader signal is that buyers have more selection than they did in extremely tight inventory environments.
What more inventory changes for buyers
More listings can give buyers more room to:
- compare similar homes,
- reject properties with obvious condition problems,
- question aggressive pricing,
- evaluate multiple neighborhoods,
- watch properties that sit longer,
- and negotiate more selectively when a listing has weaker demand.
That does not mean every buyer automatically has leverage.
A standout property can still attract quick competition.
For broader context, our article on how increased inventory is changing buyer negotiation across South King County explains why negotiating power depends on the specific home rather than a countywide label.
What more inventory changes for sellers
More competition means sellers need to think more carefully about:
- launch price,
- current active listings,
- recent closed sales,
- price reductions nearby,
- condition,
- presentation,
- photos,
- and buyer feedback.
When buyers have alternatives, the market becomes less forgiving of a listing that does not compare well.
Is Maple Valley becoming a buyer's market?
Maple Valley is giving buyers more choice, but the current data does not support assuming that buyers control every transaction.
The July report labels 2.6 months of inventory as a seller-favored market, but that single label does not capture the entire picture. The same dataset also shows year-over-year price softness and more inventory, while homes that sell are still moving in a median 12 days and averaging 99.5% of list price.
The better description is:
Maple Valley has become more selective and more balanced than the most aggressive seller-driven markets of recent years.
Buyers may have more time and more negotiating opportunities on certain homes.
Sellers can still have strong results when pricing and presentation align with current demand.
That is more useful than trying to force every Maple Valley transaction into a single “buyer” or “seller” market label.
What does the current Maple Valley market mean for buyers?
Maple Valley buyers have more room to compare homes and question aggressive pricing, but they should still be prepared to move quickly when a well-priced property fits their needs.
The combination of more inventory and relatively fast sales suggests buyers should be selective without becoming passive.
A practical buyer strategy is to look at:
Recent comparable sales
What did similar homes actually close for?
Active competition
How many comparable homes could a buyer choose instead?
Days on market
A home listed for three days and one sitting for 45 days may create very different negotiating situations.
Price reductions
A reduction can indicate that the original price missed the market, although it does not automatically mean the seller will accept another large discount.
Condition
When buyers have more choices, homes needing work often face more direct comparison with move-in-ready alternatives.
Monthly payment
A lower sale price does not always mean lower affordability if financing costs or other expenses change.
The broad 2026 market is giving many buyers more options than during tighter inventory periods, but the right offer strategy still depends on the individual home.
What does the current market mean for Maple Valley sellers?
Maple Valley sellers can still sell quickly, but the market is less forgiving of pricing that is disconnected from current buyer expectations.
This is where the 99.5% sale-to-list ratio needs careful interpretation.
At first glance, that number can sound like sellers can simply choose a high asking price and expect buyers to pay almost all of it.
That is not what the metric proves.
Why a high sale-to-list ratio does not mean sellers can overprice
A sale-to-list ratio compares a closing price with a source's chosen list-price field.
Depending on the dataset, that may be the original asking price or the most recent asking price.
A home can:
- start too high,
- sit on the market,
- receive a price reduction,
- and later sell close to the reduced asking price.
The final ratio can still look strong even though the original pricing strategy caused the property to sit.
That is why sellers should consider multiple signals together:
- original list price,
- final list price,
- days on market,
- price reductions,
- competing listings,
- recent comparable sales,
- and buyer activity.
The goal is not simply to sell “close to list.”
The goal is to position the home correctly from the beginning based on the market that exists now.
How does Maple Valley fit into the broader King County market?
King County provides useful context, but Maple Valley buyers and sellers should rely more heavily on Maple Valley-specific data when making a local real estate decision.
NWMLS reported a $889,000 median sales price for King County in June 2026, making it one of the most expensive counties in the NWMLS service area.
That countywide figure combines many very different housing markets, including higher-cost Eastside communities, Seattle, suburban markets, condominiums, and areas with different housing mixes.
It should not be treated as the expected price of a Maple Valley home.
The useful role of King County data is to show the broader environment.
The useful role of Maple Valley data is to help make a Maple Valley decision.
For more county-level context, see our guide to the broader King County and Washington home-price picture in 2026.
What should we watch next in the Maple Valley housing market?
The next important signals are whether inventory continues to grow, whether homes take longer to sell, and whether year-over-year price softness continues through late summer and fall.
The most useful metrics to track are:
- Median sold price
Is the year-over-year decline narrowing, widening, or reversing? - Active inventory
Are buyers continuing to gain more selection? - New listings
Are more sellers entering the market? - Pending sales
Is buyer demand keeping pace with supply? - Closed sales
Are transactions actually increasing? - Median days on market
Are homes taking longer to find a buyer? - Sale-to-list ratio
Are successful closings moving farther below asking price? - Price reductions
Are more sellers adjusting after launch?
No single metric should be read by itself.
The best picture comes from watching several indicators together.
Expert insight: What this means locally
The Maple Valley housing market is not sending one simple signal.
Prices are softer than a year ago in several current datasets. Buyers have more choices. Sellers face more competition.
At the same time, homes that match current buyer expectations can still move quickly.
That is why neither of these statements tells the whole story:
“Prices are down, so buyers control the market.”
or:
“Homes sell fast, so sellers can ask whatever they want.”
A better way to read Maple Valley right now is:
A softer median price does not mean buyers control every deal, and a fast sale does not mean sellers can ignore the market.
Buyers should compare.
Sellers should price carefully.
Both sides should pay attention to the specific property rather than relying on a broad headline.
Frequently asked questions
Are Maple Valley home prices dropping in 2026?
Current data shows year-over-year softness in Maple Valley home-price measures. A July NWMLS-derived report showed the median sold price down 6.7%, while Zillow's June Home Value Index was down 2.7% year over year. The measures are different, but both point toward softer pricing compared with a year earlier.
Is Maple Valley a buyer's market right now?
Buyers have more choice, but it is more accurate to describe Maple Valley as a more selective market than to assume buyers control every transaction. Homes are still selling relatively quickly, and successful closings remain close to asking price in current data.
How long are homes taking to sell in Maple Valley?
Current sources generally show relatively short market times, although the exact figure varies by methodology. The July NWMLS-derived report shows a 12-day median, Zillow reports roughly 13 days to pending, and Redfin's recent three-month data reports an even faster pace.
Why do Zillow and Redfin show different Maple Valley home prices?
They use different methodologies, dates, and measurements. Zillow publishes both a Home Value Index and sale-price statistics, while Redfin reports MLS/public-record sale-price trends over its chosen reporting periods. Those values should not be treated as identical metrics.
Can Maple Valley buyers negotiate more right now?
Some buyers may have more room to negotiate because inventory has increased and more listings are competing for attention, but leverage still depends on the individual property. Price, condition, days on market, competing listings, and seller motivation all matter.
Should Maple Valley sellers lower their asking price?
Not automatically. Sellers should price from current comparable sales, competing inventory, condition, location, and buyer response. A market with softer prices does not mean every home needs a price cut, but it does make unrealistic pricing harder to sustain.
Helpful resources
Northwest Multiple Listing Service: June 2026 Market Snapshot
Official regional and King County market context, including inventory, sales, months of supply, and median pricing.
Maple Valley July 2026 Market Report
NWMLS-derived city-level reporting for July 2026, including median price, inventory, days on market, and sale-to-list ratio.
Zillow Maple Valley Housing Market
Useful for understanding Zillow's Home Value Index, inventory, sale-price data, and days to pending.
Redfin Maple Valley Housing Market
Provides a separate MLS/public-record view of Maple Valley prices, market time, sale-to-list behavior, and competition.
Realtor.com Maple Valley Market Overview
Provides additional citywide data on listings, sale prices, and market time using Realtor.com's methodology.
Perkins & Associates: Maple Valley Home Prices
Additional local context on Maple Valley price direction.
Perkins & Associates: South King County Buyer Negotiation
Explains how increased inventory can affect buyer strategy across nearby South King County markets.
Your Next Move
If you are thinking about buying, selling, or planning your next move, our team is happy to help you think through your options and next steps.
📧 [email protected]
📱 (206) 960-4985
Honest. Effective. Reliable.