King County Housing Market September 2026: What Maple Valley Buyers and Sellers Should Know
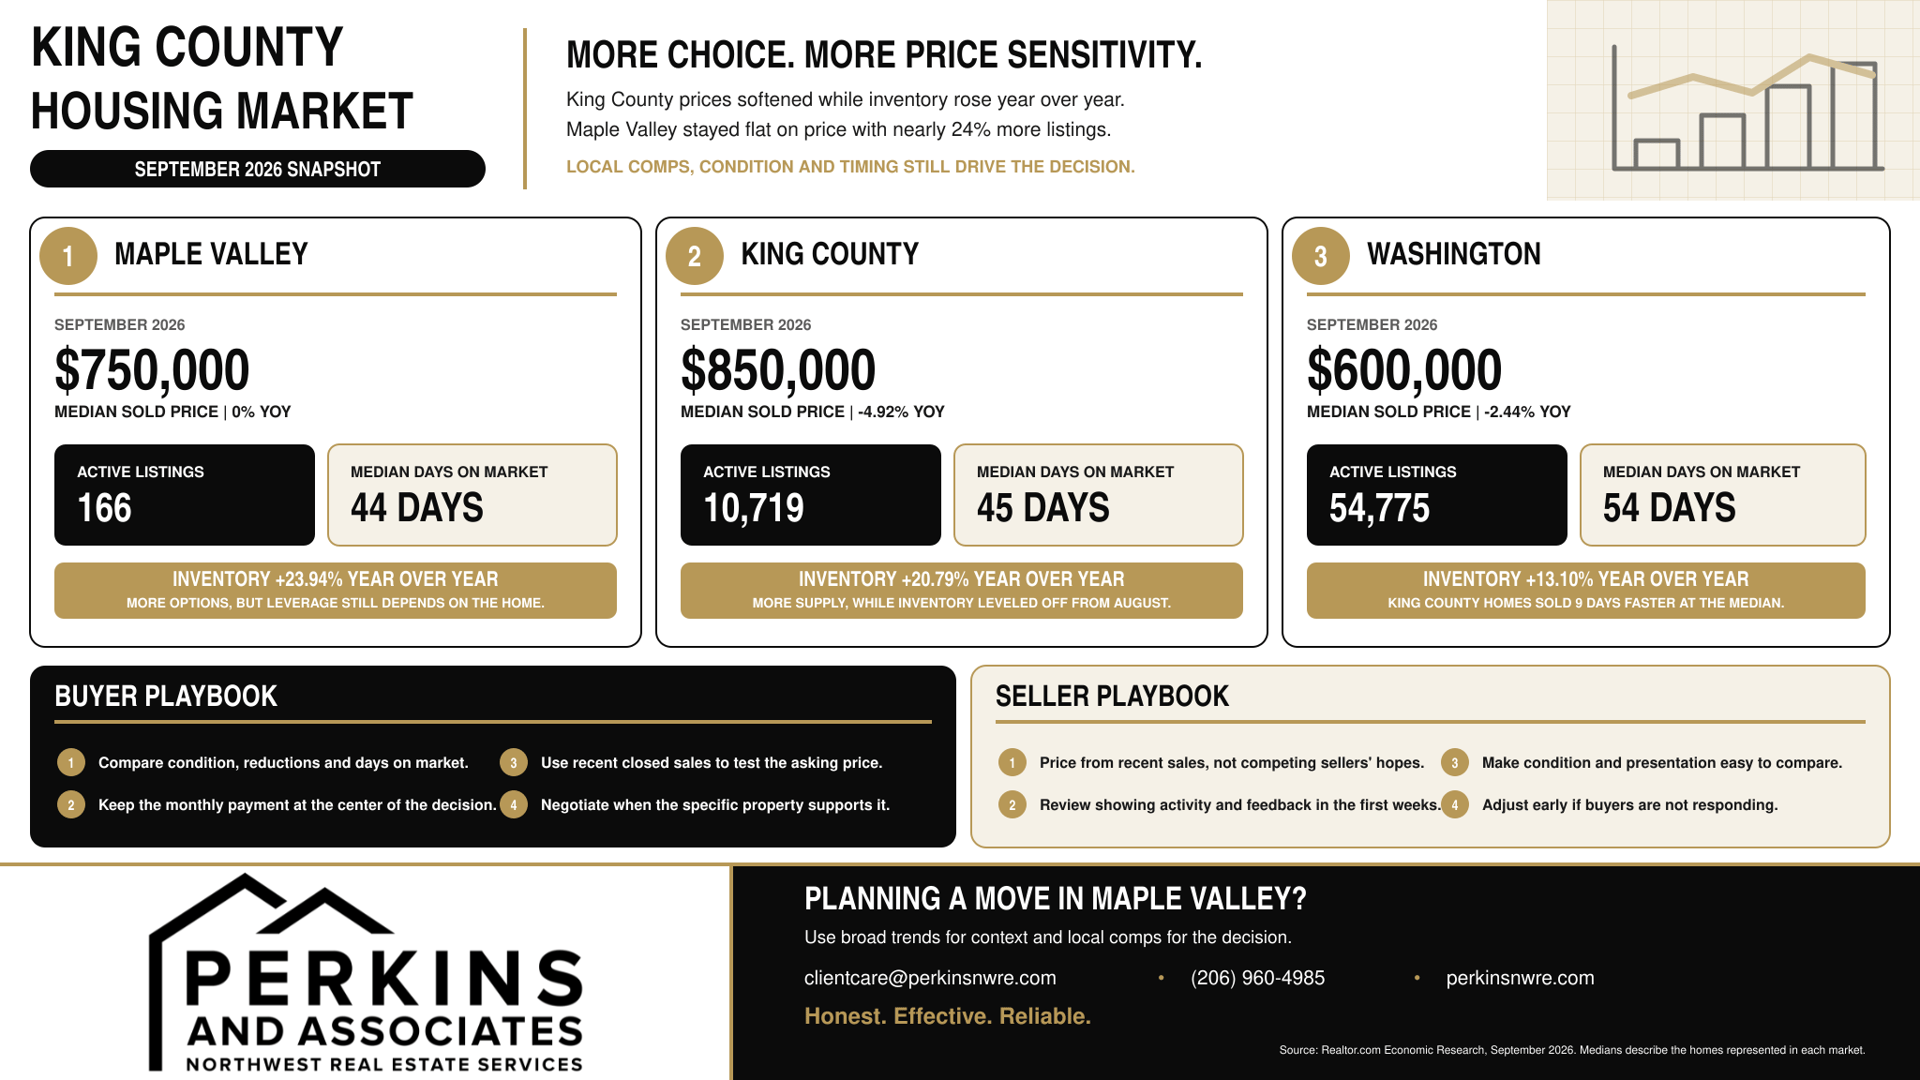
King County's median sold price was $850,000 in September 2026, compared with $600,000 across Washington State.
That $250,000 difference shows how much more expensive the King County housing market remains. But price alone does not tell the full story.
King County's median sold price was down 4.92% year over year, while active listings were up 20.79%. Homes took a median 45 days to sell. Statewide, prices were down 2.44%, inventory was up 13.10%, and homes took 54 days to sell.
For a Maple Valley buyer or seller, the local numbers are even more useful.
Maple Valley's September median sold price was $750,000, active inventory reached 166 homes, and median days on market was 44 days. The city's median sold price was unchanged from September 2025 even though buyers had nearly 24% more active listings to choose from.
So September's story is not simply that prices are falling.
It is that buyers have more options, sellers face more competition, and the right strategy depends much more on the individual home.
Key takeaways
- King County's September median sold price was $850,000.
- Washington's statewide median sold price was $600,000.
- King County was $250,000 higher, or about 42%.
- King County median sold prices were down 4.92% year over year.
- King County active inventory was up 20.79% from September 2025.
- Maple Valley's September median sold price was $750,000.
- Maple Valley's sold-price median was flat year over year.
- Maple Valley active inventory was up 23.94% year over year.
- Homes in Maple Valley took a median 44 days to sell.
- More inventory can create negotiation opportunities, but it does not mean every listing is a buyer's market.
- Sellers should price from current comparable sales rather than broad county averages or asking-price headlines.
September 2026 housing market snapshot
September 2026 | Maple Valley | King County | Washington |
|---|---|---|---|
Median sold price | $750,000 | $850,000 | $600,000 |
Median listing price | $850,000 | $849,000 | $649,000 |
Active listings | 166 | 10,719 | 54,775 |
Median days on market | 44 | 45 | 54 |
Median sold price YoY | 0% | -4.92% | -2.44% |
Source: Realtor.com Economic Research, September 2026.
Realtor.com's Residential Real Estate Data Library uses MLS-listed homes and aggregates information from multiple sources. Its active-listing measure is a monthly snapshot of available for-sale properties.
Realtor.com Residential Real Estate Data Library
What happened in the King County housing market in September 2026?
King County entered fall with more inventory than a year earlier and softer median pricing, but homes were still selling faster than they were statewide.
September's main King County numbers were:
- Median sold price: $850,000
- Median listing price: $849,000
- Active listings: 10,719
- Median days on market: 45
- Median sold price change: -4.92% YoY
- Active inventory change: +20.79% YoY
The county's median listing price was also down 1.18% year over year.
One detail is important: inventory was down 0.44% from August within Realtor.com's own series.
So the more accurate takeaway is not that supply continued to surge in September.
It is that buyers had substantially more choices than they did one year earlier, while inventory was beginning to level off as the market moved into fall.
King County September housing data
How does King County compare with Washington State?
King County remained considerably more expensive.
The September median sold price was:
King County: $850,000
Washington: $600,000
That is a $250,000 difference, putting the King County median roughly 42% above the statewide figure.
The asking-price difference was also substantial.
King County's median listing price was $849,000 compared with $649,000 statewide.
But King County homes were still moving faster.
Median days on market were:
King County: 45 days
Washington: 54 days
So even with higher prices and more year-over-year inventory growth, King County homes were taking about nine fewer days to sell at the median.
Washington September 2026 housing data
Are King County home prices falling?
The median sold price was lower than a year ago, but that does not mean every King County home lost 4.92% of its value.
Realtor.com reported the county median sold price down 4.92% from September 2025. Washington's statewide median was down 2.44%.
That means King County's median declined more sharply in this dataset.
But medians need context.
A median sold price identifies the middle price among the homes that sold during the period. It can change because:
- different types of homes sold
- more expensive or less expensive neighborhoods represented a larger share of transactions
- the mix of condos, townhomes and single-family homes changed
- new-construction closings changed
- actual market values changed
Usually, more than one factor is involved.
The National Association of Realtors also notes that sales-price medians can show seasonal variation because the mix and level of activity change throughout the year.
So a 4.92% countywide decline should not be used as an automatic adjustment to the value of a Maple Valley home.
Are King County buyers getting more choices?
Yes, compared with September 2025.
King County active listings were up 20.79% year over year, substantially more than Washington's statewide increase of 13.10%.
That can help buyers because a larger selection makes it easier to:
- compare competing homes
- be more selective about condition
- watch how long a home has been listed
- compare price reductions
- question aggressive asking prices
- walk away when a property does not offer enough value
But more inventory does not make every home negotiable.
A new listing that is priced correctly and shows well can have a completely different negotiation environment from a property that has been sitting for 60 days.
For more on that distinction, see our guide to where South King County buyers have gained more negotiating power.
What did the September Maple Valley housing market look like?
This is where the countywide numbers become more useful.
Realtor.com's September Maple Valley data shows:
- $750,000 median sold price
- $850,000 median listing price
- 166 active listings
- 44 median days on market
- 0% year-over-year change in median sold price
- 23.94% year-over-year increase in active listings
- 98% average sale-to-list ratio
Realtor.com also reports that Maple Valley homes sold about 1.6% below asking on average during September.
Maple Valley September 2026 market data
The local market therefore looked somewhat different from King County overall.
King County's median sold price fell 4.92% year over year.
Maple Valley's median sold price was flat.
King County had 20.79% more inventory than a year earlier.
Maple Valley inventory increased even more, by 23.94%.
Yet Maple Valley homes still took a median 44 days to sell, almost identical to King County's 45-day median.
Is Maple Valley cheaper than King County?
On September's median sold-price measure, yes.
Maple Valley's median sold price was $750,000, compared with $850,000 countywide.
That is a $100,000 difference.
But it would be misleading to conclude that every Maple Valley home is simply $100,000 cheaper than a comparable King County property.
King County includes very different markets, housing types and price points.
Bellevue, Seattle, Federal Way, Renton, Maple Valley and Black Diamond all contribute to the countywide figures.
A Maple Valley buyer should use King County as context, then make decisions based on Maple Valley neighborhoods and comparable homes.
Our earlier guide on why nearby South King County markets can move at different speeds explains why countywide averages only go so far.
What does the $850,000 Maple Valley listing median really tell us?
It does not mean the typical seller listed for $850,000 and accepted $750,000.
Those two medians represent different groups of properties.
Maple Valley's September median listing price was $850,000, while its median sold price was $750,000.
Subtracting those numbers and saying homes sold $100,000 below asking would be incorrect.
Instead, the gap tells sellers something more useful:
current asking prices and recent closed-sale prices are not sending exactly the same signal.
That is one reason sellers should rely on:
- recent comparable sales
- active competing listings
- pending activity
- condition
- lot and location
- days on market
- buyer feedback
rather than assuming that the portal's current median asking price defines what their home should sell for.
For more local pricing context, see our analysis of why softer Maple Valley prices can coexist with active buyer demand.
Do Maple Valley buyers have more negotiating room?
Some buyers do, especially when a home has been sitting, needs work or is priced above recent comparable sales.
The strongest evidence is the combination of:
- inventory up nearly 24% year over year
- 44 median days on market
- 98% sale-to-list ratio
- average closed price about 1.6% below asking
That is a different environment from one where buyers have only a handful of homes to choose from and every desirable listing immediately receives several aggressive offers.
But it is not a reason to assume every seller will take 2% less.
Realtor.com classified Maple Valley as a seller's market in September. Market labels are broad, and individual listings can behave differently, but that classification is another reason not to describe Maple Valley as a buyer-controlled market.
The better description is:
Maple Valley buyers have more options and more opportunities to negotiate than they did a year ago, but leverage still depends on the property.
What should Maple Valley buyers do in this market?
More inventory gives buyers a chance to slow down enough to compare value.
That does not mean waiting indefinitely for a large market decline.
A practical September strategy is to look closely at:
Days on market. A home that has been available for several weeks may offer a different negotiation opportunity from a listing that launched yesterday.
Recent closed sales. Asking prices show what sellers want. Closed sales show what buyers actually agreed to pay.
Condition. With more homes available, buyers can compare how much work competing properties require.
Price reductions. A reduction can tell you that the seller is adjusting to market feedback.
Financing. Keep the payment, not just the purchase price, at the center of the decision.
The goal is not to negotiate simply because inventory is higher.
The goal is to recognize when a particular property gives you a reasonable reason to negotiate.
What should Maple Valley sellers do differently?
September's numbers make pricing more important, not less.
A seller is competing against 166 active listings in Realtor.com's Maple Valley dataset, up almost 24% from a year earlier.
That gives buyers more opportunities to compare:
- price
- updates
- maintenance
- lot quality
- location
- presentation
- monthly payment
Price from sales, not from other sellers' ambitions
An active listing tells you what another owner is asking.
It does not tell you what a buyer will pay.
Recent sold properties remain a stronger starting point for pricing.
Pay attention early
Maple Valley's 44-day median does not mean a seller should wait 44 days before reacting to weak activity.
The first couple of weeks can provide useful feedback through:
- showing volume
- online engagement
- agent feedback
- competing listings
- offer activity
If the response is weak, price and presentation should be reviewed before the listing becomes stale.
Condition matters more when buyers have alternatives
A buyer deciding between three similar homes can be much less forgiving about repairs, dated finishes or poor presentation than a buyer choosing from only one viable property.
More inventory raises the importance of preparation.
Are mortgage rates still affecting affordability?
Yes. Financing remained an important part of the September affordability picture.
Freddie Mac's weekly 30-year fixed mortgage average increased during September:
- September 3: 6.71%
- September 10: 6.76%
- September 17: 6.95%
- September 24: 7.03%
By October 1, the average had risen further to 7.28%.
Freddie Mac mortgage-rate archive
Those rates help explain why buyers may remain payment-conscious even when home prices soften.
But they do not prove that mortgage rates caused King County's 4.92% median-price decline.
Pricing, inventory, housing mix, seasonality and buyer demand all interact.
Is the King County housing market crashing?
September's numbers do not support describing the market that way.
King County still recorded an $850,000 median sold price.
Homes were selling in a median 45 days, faster than Washington's 54-day median.
Inventory was much higher than a year ago, but nearly flat from August.
The more accurate description is:
King County has become better supplied and more price-sensitive, with softer year-over-year median pricing.
That is very different from saying buyers have disappeared or that every homeowner is experiencing a major loss in value.
How does this compare with our August King County report?
There is an important methodology difference.
Our August 2026 King County housing market report used Northwest MLS data.
This September article uses Realtor.com Economic Research.
Those sources can differ in:
- property coverage
- geographic definitions
- listing-status methodology
- inventory measurement
- reporting periods
Realtor.com explains that its housing data comes from its database of MLS-listed homes and that historical figures can be revised as coverage and definitions improve.
That means we should not take August's NWMLS active-listing figure and directly calculate a September percentage change using Realtor.com's 10,719 listings.
Both reports can be useful.
They simply should not be treated as one continuous statistical series.
What should Maple Valley buyers and sellers watch next?
As we move further into fall, these numbers will be more useful than any single headline:
- Active inventory
Does the number of available Maple Valley homes continue to decline seasonally, or remain unusually high compared with last year? - Median sold price
Does September's flat year-over-year Maple Valley price trend continue? - Days on market
Do homes take longer to find buyers as fall progresses? - Sale-to-list ratio
Do successful closings move farther below asking price? - Price reductions
Are more sellers adjusting after coming to market? - Mortgage rates
Do financing costs continue to put pressure on monthly payments?
Watching those metrics together gives a much better picture than watching the median price alone.
Expert insight: County data sets the backdrop, local comps set the strategy
King County tells a Maple Valley buyer or seller what the larger market is doing.
It does not tell you exactly what one Maple Valley home is worth.
For a seller, the most useful pricing information still comes from nearby recent sales, competing listings, condition, lot, updates and current buyer response.
For a buyer, countywide softness does not automatically justify a low offer on a well-priced home that just hit the market.
The September data does suggest a market where strategy matters more than assumptions.
Buyers have more homes to compare.
Sellers have more competition.
Neither side should make a major decision from one countywide number.
Frequently asked questions
What was the King County median home price in September 2026?
The median sold price was $850,000, according to Realtor.com Economic Research.
How does King County compare with Washington State?
Washington's median sold price was $600,000. King County's median was $250,000 higher, or roughly 42%.
Are King County home prices falling?
The September median sold price was down 4.92% year over year. That does not mean every individual property lost 4.92% of its value.
How many active listings were in King County?
Realtor.com reported 10,719 active listings, up 20.79% year over year and down 0.44% from August.
What was Maple Valley's September median sold price?
Maple Valley's median sold price was $750,000, unchanged year over year.
How many homes were for sale in Maple Valley?
Realtor.com reported 166 active listings, up 23.94% year over year.
How long were Maple Valley homes taking to sell?
Median days on market was 44 days in September.
Is Maple Valley a buyer's market?
Realtor.com classified Maple Valley as a seller's market in September, although buyers had substantially more inventory than a year earlier. The more useful conclusion is that buyers have more choices and some listings offer greater negotiating room.
Should Maple Valley sellers lower their price?
Not automatically. Pricing should depend on recent comparable sales, competing listings, condition, location, days on market and buyer response.
Does the 4.92% King County decline mean my Maple Valley home lost 4.92%?
No. A median is a market statistic and should not replace a property-specific market analysis.
Helpful resources
King County housing market data, Realtor.com Economic Research
Maple Valley housing market data, Realtor.com Economic Research
Washington State housing market data, Realtor.com Economic Research
Realtor.com Residential Real Estate Data Library and methodology
Freddie Mac Primary Mortgage Market Survey archive
Buying or selling in Maple Valley?
September's numbers show why local context matters.
King County remains expensive compared with Washington overall, but Maple Valley buyers have more homes to compare than they did a year ago. Sellers still have opportunities, but pricing and presentation need to match what buyers are seeing today.
If you are thinking about buying or selling in Maple Valley or elsewhere in South King County, reach out to Perkins & Associates for a property-specific look at current competition, recent sales and your next move.
📧 [email protected]
📱 (206) 960-4985
Honest. Effective. Reliable.
This article provides general real estate information and is not legal advice. Association documents, purchase agreements, statutory applicability, and transaction deadlines can vary. Buyers and sellers should review their specific documents and seek legal advice when a legal interpretation is needed.